
If climate change was being tried in court, the verdict wouldn’t have hinged on any one dramatic discovery. It would have been built slowly, through evidence that accumulated like receipts: physics, laboratory experiments, climate science, careful measurements, and independent verification across generations and regions. The conclusion today, without a shadow of a doubt, is that human influence has warmed the atmosphere, oceans, and lands. This is not a hunch or a trend – it is the product of two centuries of scientific inquiry.
The story begins in the early 1800s, when the French mathematician Joseph Fourier asked a deceptively simple question – given the Sun’s energy, why isn’t Earth much colder? His answer was that the atmosphere acts like an insulating layer, helping retain heat.[1] In modern terms, Fourier identified that Earth’s temperature is not a “sun setting” problem, it’s a balance sheet. Incoming solar energy is the income; outgoing infrared radiation is the expense. The atmosphere influences how quickly that expense is paid.
A few decades later, the Irish physicist John Tyndall brought laboratory proof to this idea. Through careful experiments, he showed that certain gases especially water vapour and carbon dioxide (CO2) absorb infrared radiation.[2] In other words, the atmosphere is not a neutral window, its composition controlling how efficiently Earth can shed heat. CO2, in this sense, is not “dirty” by default; it’s just a control knob. Turn it up, and the planet holds on to more warmth.
In 1896, Swedish scientist Svante Arrhenius took the next step by estimating how changes in atmospheric CO2 could affect global temperatures. His calculations were rough by today’s standards, but the logic was sound: altering CO2 alters Earth’s energy balance.[3] At this point, the greenhouse effect was not controversial. It was simply physics. The more difficult leap was recognising that humans might be adjusting this planetary thermostat. In 1938, Guy Stewart Callendar compiled temperature records and argued that warming was already detectable and linked to fossil fuel use.[4] This was one of the first serious attempts to connect human emissions to observed temperature changes.
Then came an important reality check. In 1957, Roger Revelle and Hans Suess challenged the comforting idea that the oceans would quickly absorb humanity’s excess CO2 without consequence. They showed that chemical “buffering” limits how fast oceans can take up carbon.[5] By 1960, Charles David Keeling had provided something even more compelling than theory: precise continuous measurements. His data showed a steady rise in atmospheric CO₂, alongside a seasonal “breathing” cycle driven by vegetation (CO2 falling during the growing season as plants absorb it, then rising as growth slows and decay releases it).[6] This was the start of what we now call the Keeling Curve era. Climate science, at this point, became less about speculation and more about instrumentation.
In parallel, models caught up with the measurements. In 1967, Syukuro Manabe and Richard Wetherald used physical climate models to show how increasing CO2 traps more outgoing heat, warming the surface and amplifies water vapour feedbacks (warmer air holds more moisture, which further strengthens warming).[7] And in 1979, the Charney Report synthesised existing evidence and estimated climate sensitivity, offering an early high-level “sanity check” from leading scientists by constraining how much warming is expected from a doubling of CO2.[8][AW3] Fast forward to today, the Intergovernmental Panel on Climate Change (IPCC). A United Nation’s body established in 1988 by the World Meteorological Organization (WMO) and the United Nations Environment Programme (UNEP) synthesises hundreds of peer-reviewed studies and concludes it is unequivocal that human influence has warmed the atmosphere, oceans, and land.
A useful way to think about it is like a forensic investigation: physics explains the mechanism, measurements capture the signal, and attribution studies identify the fingerprint.
Despite this, several myths persist. Sometimes because they contain a grain of truth. Often spread with a malicious intent.
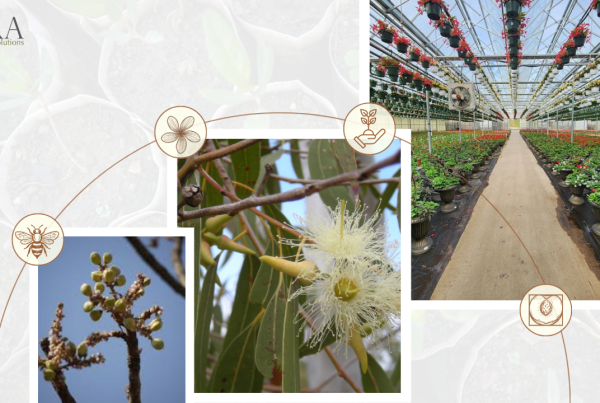
Take the claim that “carbon is good for the environment because plants need CO2.” Yes, CO2 is a basic input to photosynthesis. But saying more CO2 is always good is like saying more medicine is always healthy. The dosage matters and so does the context and its side effects. While elevated CO2 can stimulate plant growth under certain conditions, real ecosystems often run into constraints, especially limited by nitrogen and phosphorus.[9] Large-scale analyses show that nutrient availability restricts the so-called “CO2 fertilisation effect.” [10] And even where plants grow faster with elevated CO2, it does not cancel out the droughts, floods, and ecosystem disruptions driven by excess greenhouse gases.[11]
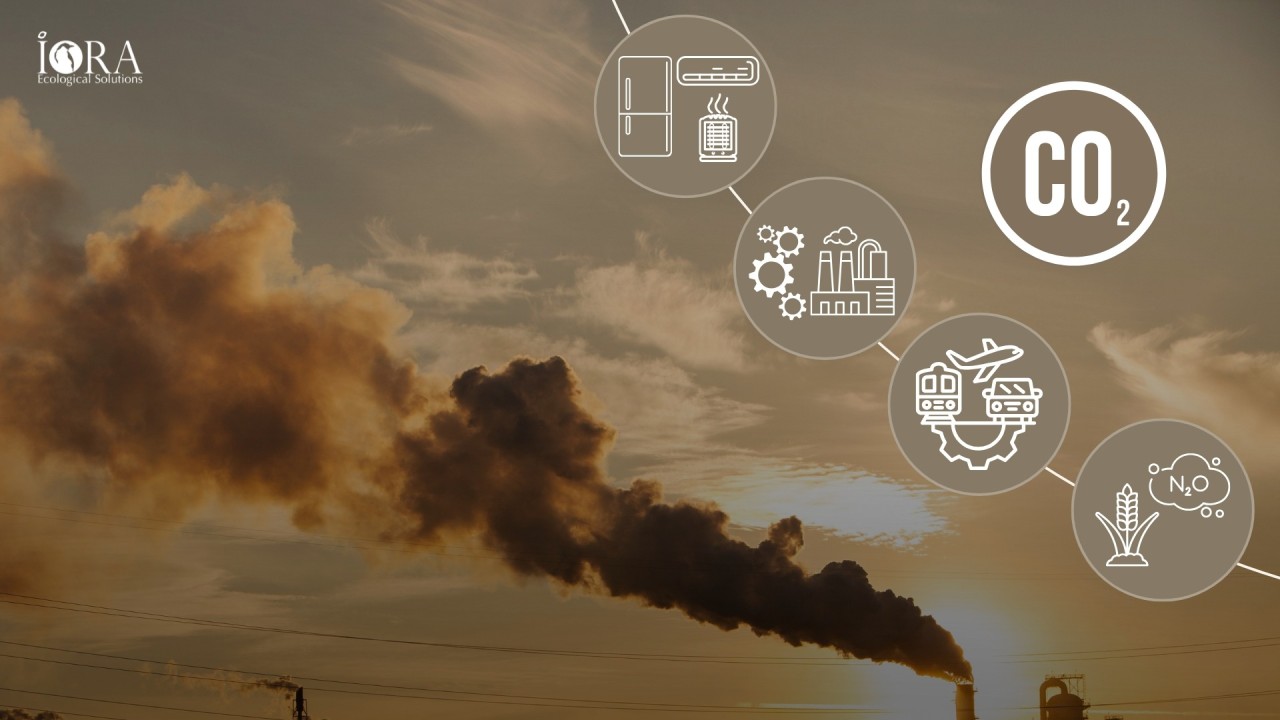
Another common myth is that methane and nitrous oxide are “more dangerous” than carbon dioxide, so CO₂ cuts don’t really matter. It’s true that CH4 and N2O are more potent per tonne (higher GWP)[12], but potency isn’t the whole story. Methane is short-lived (around a decade), so cutting it can deliver faster near-term benefits; nitrous oxide is highly potent and long-lived, locking in warming for decades; and CO2 accumulates and largely determines long-term warming. A credible strategy targets all three – rapid CH4 cuts for near-term relief, steady N2O reductions for long-tail warming, and deep CO2 cuts to stabilise temperatures.
Then there’s the most commonly said idea that “climate has always changed, so today’s change is natural.” Climate does vary naturally, but the current pattern and pace of warming matches what we expect from greenhouse gas increases, not from solar cycles or volcanic activity. Natural variability is real, but so is arson! The key question is what started this particular fire.
This brings us to what “emissions reduction” actually means. It’s not a slogan or a lifestyle trend. It’s a systems requirement. Picture the atmosphere as a bathtub: emissions are the tap, natural sinks such as forests, soils, oceans are the drain. Climate risk grows as the water level rises. Reducing emissions means turning down the tap fast enough that the level stops rising, while also protecting and strengthening the drain where possible.
Why does this matter so much now? Because the climate system has inertia, but it is also responsive. The IPCC shows that deep, rapid, and sustained reductions in greenhouse gas emissions would slow warming within decades and begin to stabilise atmospheric composition within years.[13] Delaying cuts is like choosing higher interest on a debt you already struggle to service.
Importantly, emissions reduction is not about perfection; it is about discipline. The most effective changes are often unglamorous – energy efficiency, strong operations and maintenance, smarter procurement, reduced waste, and designs that avoid unnecessary demand. They rarely make headlines, but they shift the trajectory.
International Emissions Reduction Day, observed on 28th January, is best treated not as a symbolic gesture but as a checkpoint: a chance to ask what we measured, what we reduced, and what we will verify next. Climate science did not arrive as a trend; it emerged through a methodical chain of evidence built over decades. The modern question, then, is not whether warming is real, but how quickly we can cut emissions in ways that also strengthen resilience and protect livelihoods. In practice, that means moving from intent to implementation: setting clear baselines, focusing on the biggest levers, and tracking outcomes with the same seriousness we apply to cost, quality, and risk. Because ultimately, credibility in climate action comes down to one thing – turning commitments into reductions that can be demonstrated, sustained, and scaled.
[1] https://geosci.uchicago.edu/~rtp1/papers/Fourier1827Trans.pdf
[2] Tyndall, J. (1861). I. The Bakerian Lecture-On the absorption and radiation of heat by gases and vapours, and on the physical connexion of radiation, absorption, and conduction. Philosophical Transactions of the Royal Society of London. https://shorturl.at/pD2Kk
[3] Arrhenius, S. (1896). On the influence of carbonic acid in the air upon the temperature of the ground. Philosophical Magazine. https://empslocal.ex.ac.uk/people/staff/gv219/classics.d/Arrhenius96.pdf
[4] Callendar, G. S. (1938). The artificial production of carbon dioxide and its influence on temperature. Quarterly Journal of the Royal Meteorological Society. https://www.met.reading.ac.uk/~ed/callendar_1938.pdf
[5] Revelle, R., & Suess, H. E. (1957). Carbon dioxide exchange between atmosphere and ocean and the question of an increase of atmospheric CO2 during the past decades https://geosci.uchicago.edu/~archer/warming_papers/revelle.1957.CO2_buffer.pdf
[6] Keeling, C. D. (1960). The concentration and isotopic abundances of carbon dioxide in the atmosphere. https://tellusjournal.org/articles/3457/files/6572a8eb567d8.pdf
[7] Manabe, S., & Wetherald, R. T. (1967). Thermal equilibrium of the atmosphere with a given distribution of relative humidity. Journal of the Atmospheric Sciences. https://journals.ametsoc.org/view/journals/atsc/24/3/1520-0469_1967_024_0241_teotaw_2_0_co_2.xml
[8] National Research Council. (1979). Carbon Dioxide and Climate: A Scientific Assessment (Charney Report). Washington, DC: The National Academies Press https://geosci.uchicago.edu/~archer/warming_papers/charney.1979.report.pdf
[9] Ainsworth, E. A., & Long, S. P. (2005). What have we learned from 15 years of free‐air CO2 enrichment (FACE)? A meta‐analytic review of the responses of photosynthesis, canopy properties and plant production to rising CO2. New phytologist, 165(2), 351-372. https://nph.onlinelibrary.wiley.com/doi/10.1111/j.1469-8137.2004.01224.x
[10] Terrer, C., et al. (2019). Nitrogen and phosphorus constrain the CO2 fertilization of global plant biomass. Nature Climate Change, 9, 684–689. https://www.nature.com/articles/s41558-019-0545-2
[11]IPCC, 2021: Summary for Policymakers. In: Climate Change 2021: The Physical Science Basis. Contribution of Working Group I to the Sixth Assessment Report of the Intergovernmental Panel on Climate Change [Masson-Delmotte, V., P. Zhai, A. Pirani, S.L. Connors, C. Péan, S. Berger, N. Caud, Y. Chen, L. Goldfarb, M.I. Gomis, M. Huang, K. Leitzell, E. Lonnoy, J.B.R. Matthews, T.K. Maycock, T. Waterfeld, O. Yelekçi, R. Yu, and B. Zhou (eds.)]. In Press. https://www.ipcc.ch/report/ar6/wg1/downloads/report/IPCC_AR6_WGI_SPM_Stand_Alone.pdf
[12] Global Warming Potential (GWP) is a CO₂-equivalent measure of relative warming impact that accounts for atmospheric lifetime, typically over 100 years
[13] https://www.ipcc.ch/report/ar6/syr/downloads/report/IPCC_AR6_SYR_SPM.pdf